Where every number comes from.
The planner shows a dollar figure for almost everything. Each one carries a label, and the label tells you how much to trust it. This page explains the three labels, the data behind them, and what we do not know.
The three labels
Published A figure taken from a named source on a stated date, with arithmetic you can check. Example: the one-day ticket price for your park on your date, multiplied by your party, plus 6.5% Florida sales tax. If the source is right, the number is right.
Estimate Arithmetic on published figures with an assumption you can change. Example: a dinner priced from a restaurant's published entree range, at the midpoint, for two adults and two children, with tax and an 18% tip. Change the price point or the tip and the number moves.
Yours A number you typed: a hotel quote you got from Disney, your flights, your souvenir budget. We do not check it.
None of these are Disney or Universal quotes. A price in Disney's or Universal's own checkout always beats anything on this site. The planner is for deciding what to book, not a substitute for booking it.
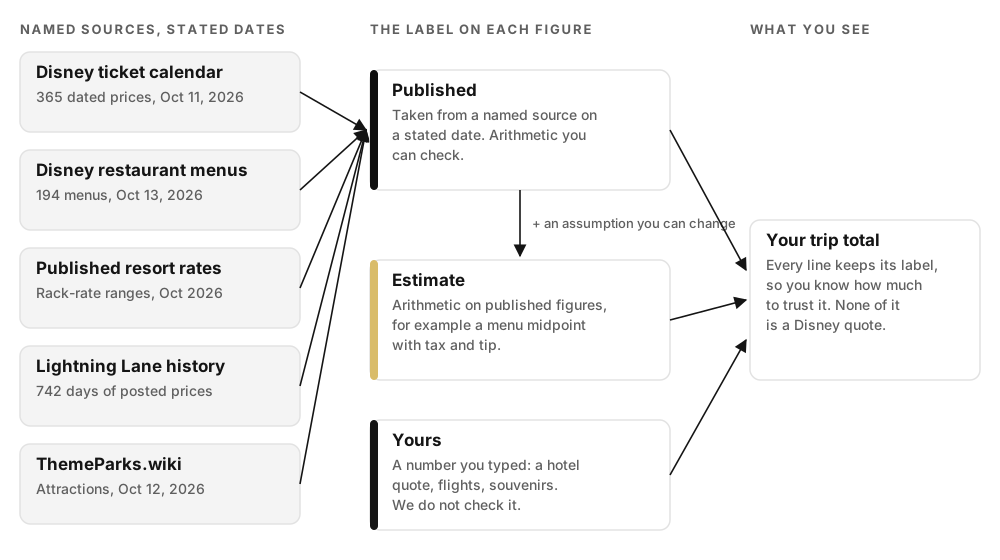
The data
| What | Coverage | Source and date | What it does not cover |
|---|---|---|---|
| Park tickets | 365 dated one-day adult prices across all four parks. The child price is the adult price less $5. | Capture of Disney's public ticket calendar, October 11, 2026. | Annual passes, Florida resident and promotional pricing. Multi-day and Park Hopper tickets are placed within Disney's published ranges. |
| Dining | 519 locations: 385 at Walt Disney World (292 with a published price guide, 384 with a guest-approval rating) and 134 at Universal Orlando. | Item-level menus from Disney's own pages for 194 Walt Disney World restaurants, October 13, 2026. TouringPlans guest surveys and price ranges for the rest and for Universal. | Menus that change after the capture date, and seasonal and festival menus. Add-ons under $2, like extra sauces and toppings, are left out of the menu averages. Drink prices at restaurants without an item-level menu are not covered; enter your own in Exact items. |
| Resorts | 143 hotels: 98 Walt Disney World resort products and 45 Universal Orlando and partner hotels. 43 of them have published nightly planning ranges. The rest ask for your quote. | Published rack-rate ranges for a standard room, two adults, room only, collected October 2026. | Live availability, discounts, and suites or villas. The planner adds room tax: 12.5%, or 13.5% at the All-Star resorts. It does not add resort fees at partner hotels, so check those at checkout. |
| Special events | 106 dated party and after-hours nights. | Secondary-source price captures, with each event's own dates. | Sell-outs after our snapshot. Prices change by date. |
| Park hours | Reported hours through December 21, 2026. After that, the most common schedule by month over the two prior years. | WDWMAGIC reported calendars. | Hours Disney has not yet published are a pattern, not a schedule. |
| Lightning Lane | Daily posted Multi Pass prices per park for 742 days, July 21, 2024 to November 2, 2026. That includes three weeks Disney had already posted beyond the capture date. Premier Pass daily prices for November 1 to December 10, 2024. | Thrill Data price history for Multi Pass. AllEars price history for Premier Pass. RopeDrop price history with crowd levels for 2026. | The exact price on a future date, which Disney sets daily. Premier Pass beyond its first season. |
| Rides and shows | 147 attractions and shows with map coordinates, height requirements, thrill level, durations and planning waits. | ThemeParks.wiki attraction list, October 12, 2026. Height requirements compiled from Disney's published list. | Closures and refurbishments after our snapshot. Waits are planning tiers, not predictions. |
| Live wait times | Current posted waits and status for every open ride, refreshed every five minutes. | ThemeParks.wiki live feed. "Powered by ThemeParks.wiki". | Future days (live data is for today only). |
| Weather | A forecast when your dates are within about two weeks. Otherwise, the same dates from the previous three years, averaged. | Visual Crossing, fetched when you open your plan. | A guarantee of anything. Florida has afternoon storms, so pack for them. |
| Transportation | Airport transfer options and theme-park parking. | Published fares and Disney's posted parking rate. | Surge pricing, tolls and tips. |
How the Lightning Lane estimate is built
Disney posts Lightning Lane prices a few weeks ahead. So the history includes dates up to about three weeks after the capture date. Those are posted prices, not observations of days that have happened. For a date that already has a posted price, we show that price. For a future date, we find the comparable day one year earlier. Days within a holiday window move with the holiday. Easter, Thanksgiving, Presidents Day, Memorial Day, Labor Day and the MLK weekend each fall on a different date every year. So a Thursday that is Thanksgiving 2026 is compared with Thanksgiving 2025, not with the same calendar date. Christmas week and the July 4 week stay on the calendar date. Every other day is compared with the same weekday 52 weeks earlier. We then add the yearly increase we have measured for that park across every matched pair of days. It is +7.9% at Magic Kingdom, +8.8% at EPCOT, +7.4% at Hollywood Studios and +1.9% at Animal Kingdom. Across all parks it is +6.5% (median +6.7%), from 1,512 matched days. Holiday weeks have risen faster than the average: Thanksgiving +16%, Presidents Day +16%, Memorial Day +19%. The planner shows both the price a year ago and the estimate, with the alignment it used. When no comparable day exists it falls back to the nearest posted days within four days of the date, then to a seasonal pattern. Premier Pass has one year of posted prices, so its estimate uses 5% a year as a planning assumption.
How the park day timeline is built
For each park day the planner takes every attraction in that park. It removes anything a child in your party is too short for, with two exceptions. It keeps the ride with a Rider Switch note when at least one child can ride. And it keeps a headliner for the adults to swap on when every child is too short and no one is under six. It then orders the rest. On a rope-drop day it starts with the biggest ride your party can board. That first wait is shorter, because you are at the gate at opening. On a relaxed day, or after you tap "We're running late", there is no rope drop and the first ride carries its normal wait. Then it moves through the park by priority and walking distance. The Lightning Lane or Express rides you bought come before lower-priority rides. The meals you saved go at lunch and dinner. A re-plan can move their times, so check them against your reservations. When someone is under six, it adds an afternoon reset, using the ages you entered. The parade and the closing show go where Disney usually runs them. Scheduled shows fill the late afternoon. Walking times come from the real distance between attractions, at 2.6 miles an hour, with a factor for winding paths. No stop is scheduled to end after park close; a ride that would run past close is listed under Did not fit.
Waits are planning tiers (quiet, typical, peak) assigned per ride from planning norms, not a forecast for your date. When you open the timeline on the day itself, live posted waits replace them. Lightning Lane Multi Pass is modeled as a 10-minute wait on the three rides named under Book first on the Lightning Lane page. Those are the eligible rides with the highest waits. If a short day cannot fit all three, the day says which one did not fit. Premier Pass is modeled as a 10-minute wait on every eligible ride.
How the packing list is built
The packing list comes from eight questions plus the weather for your dates. The questions cover dates, party, anyone under six, fancy dinners, water park, pool, flying or driving, and laundry. The clothes count scales with trip length and halves if you plan to do laundry. Swimsuits, water shoes, dinner outfits, stroller gear and carry-on rules appear only when your answers call for them.
What the chat does and does not do
"Ask the planner" uses an AI model to understand what you type, such as dates, party, parks, hotel tier and pace. Then it fills in the plan. It is not allowed to state prices. Every number on the page comes from the data tables above, never from the model.
Affiliate links
Gear links in the packing list go to Amazon. If you buy through them, Mouse Money Planner may earn a commission at no extra cost to you. We list items we would pack ourselves; nobody pays to be on the list.
What we get wrong, and how to tell us
Snapshots go stale. Do you see a price, a height requirement or an hours entry that does not match what Disney shows? Email hello@thehappiestplanner.com with a link or a screenshot, and we will fix the data.
Data snapshot October 12, 2026.